

“PPC has been an indispensable partner in our business in regards to EPA compliance and thus continued plant operations. With five projects in four plants in three states, PPC has shown versatility and commitment in providing solutions specific to our unique needs.”


FAQ
Electrostatic Precipitation
- Aluminum
- Ammonium Sulfates
- Arsenic
- Asphalt
- Bagasse Ash
- Bentonite
- Catalyst
- Cement
- Coal Ash
- Coke
- Copper
- Diesel Smoke
- Fluorspar
- Fly Ash
- Glass
- Gold
- Grease
- Gypsum
- Hydrochloric Acid
- Hydrofluoric Acid
- Incinerator Ash
- Iron Oxide
- Lead
- Oil
- Pigments
- Plastic
- Salt Cake
- Smoke
- Sulfuric Acid Mist
- Tar
- Wood Ash
- Wood Acids
- Wood Tar
- Bake Furnaces
- Black Liquor Boilers
- Cat Crackers
- Catalyst Dryers
- Cement Kilns
- Coke Ovens
- Copeland Reactors
- Cupolas
- Dry Kilns
- Dryers
- Flash Dryers
- Fluidized Bed Boilers
- Fryers
- Furnaces
- Glass Furnace
- Gypsum Kettles
- Medical Incinerator
- MDF & OSB Dryers
- Municipal Incinerators
- Plastic Molding
- PVC Molding
- Red Water Incinerators
- Sander Dust Burners
- Salts
- Smelters
- Stoker Boilers
- Syngas Recovery
- Biofuel Production
- Biomass to Energy
- Ethanol Production
- Food Processing
- Glass Making
- Oil Refineries
- Paint Processing
- Pellet Mills
- Plastic Processing
- Pulp and Paper
- Semiconductors
- Sugar Mills
- Waste Disposal
- Waste to Energy
- Wood Products
- Gas Moisture
- Gas Velocity
- Charging Voltage
- Collection Plate Design
- Gas Stream Composition
- Gas Stream Temperature
- Particle Concentration
- Physical Design of ESP
- Electrode Design
- Particle Size Distribution
- Particle Resistivity
- Particle Size
- Inlet Duct Work Configuration
- Electrode Spacing
- Gas Stream Distribution
- A = collection area required in square feet
- w = Drift of Migration velocity of the particles to be collected
- Q = Gas Flow Rate in cubic feet per second
- Eff = Fractional collection efficiency desired
- dp = diameter of particle, microns
- Eo = strength of field in which particles are charged, V / m ( V / ft )
- Ep = strength of field in which particles are collected, V / m ( V / ft )
- µ = Gas viscosity, Pa * s ( cp )
- π = 3.14159...
- The gas velocity can be so fast that the electrostatic attraction forces cannot overcome the velocity head or turbulence created by the flow of the gas stream.
- High gas velocity can strip collected particles off of the collecting surfaces, reducing overall collection efficiency.
- Increased gas velocity means decreased residence time resulting in the particles spending less time in the active collection areas.
- Airflow, as already discussed, can be too fast through the unit causing the re-entrainment of particles or the prevention of collection due to velocity head. Improper inlet duct design and improper air distribution can create situations where portions of the precipitator are receiving more flow per square foot of cross sectional area than others leading to reduces residence time, increased velocity head and re-entrainment in those areas with the net overall effect of the precipitator being less efficient.
- Voltage potential, efficiencies as shown in equations presented above, has a direct impact upon collection. The physical design of the precipitator, specifically the clear space distance between the high voltage components and the grounded (or collection) surfaces dictate the maximum achievable voltage. When voltage reaches a point where its potential is greater than that of the resistance created by the distance between high voltage and collection surface the system will discharge this potential rapidly creating a spark or arc. Take for instance a high voltage electrode that is separated from ground by one quarter of an inch, the voltage required to spark over (jump the gap) is much less than if that gap was five inches. The closer the gap the higher the current and the greater the gap the higher the voltage. Two extremes of this concept can be visualized by connecting the high voltage electrode directly to ground, a short circuit and separating the high voltage from ground by ten feet, an open circuit. In a short circuit there is no voltage between the points and very high current, in the open circuit there is full voltage but no current. Precipitators operate at point between these two extremes, at a point where there is high voltage, enough to generate corona, and relatively low current.
- Corona generation, also called ion generation, is directly dependent upon the high voltage electrode (discharge electrode) design. Sharp points and fine wires generate corona at much lower voltages than rounded or smooth corners. The collection of efficiency and current consumption rapidly increases once corona starts to occur. Corona can be seen as a visible blue or violet glow around the generation points.
What is Precipitation?
In our business, the word Precipitation refers to the process of removing a substance from a medium.
What is Electrostatic Precipitation?
Electrostatic precipitation utilizes one of the basic principles of electricity and electromagnetism: Magnetic Attraction. A charged particle will be attracted to and move toward a neutral or oppositely charged surface if enough attraction is present and the particle is not immobile.
What is an Industrial Electrostatic Precipitator?
An Industrial Electrostatic Precipitator, often called an ESP, utilizes an electrode to produce a corona that ionizes and charges particles (dust, oil, fume, etc). Once charged, the particles naturally move toward surfaces of neutral or opposite charge. Those neutral or oppositely charged surfaces can be stationary, like collections plates or ductwork; or be dynamic, like other particles in the same gas stream. Once enough particles have been accumulated in an area, one of many removal methods can be utilized to remove the collected particles.
What is the history of electrostatic precipitation?
The first recorded observation of the phenomena, that is the basis of industrial electrostatic precipitation, was in 1600 by William Gilbert, an English scientist. Gilbert wrote in his work De Magnete, that ….[electricks] entice smoke sent out by an extinguished light [flame]. The first large scale application of the electrostatic precipitation, for industrial applications, was performed in 1885 by Walker and Hutchings, who based their design upon observations and experiments of Sir Oliver Lodge, a British electrical physicist. The Walker and Hutchings precipitator had problems attributed to an inadequate power supply as well as an over abundance small highly resistive particles present in the flue gas stream.
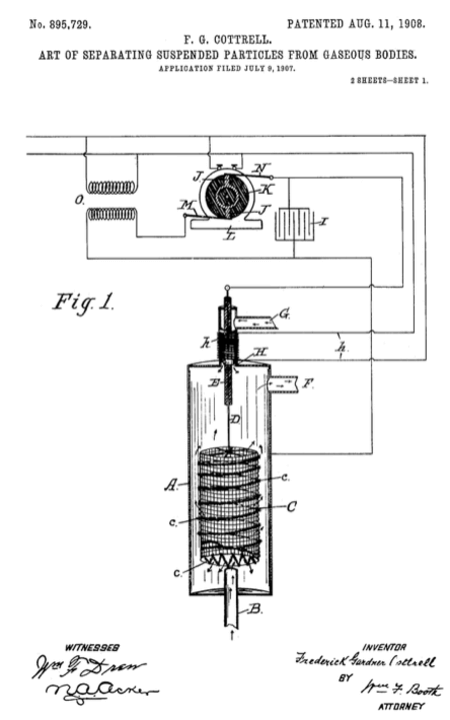
In 1906 the DuPont Corporation enlisted Frederick Gardner Cottrell to help them with the problem of separating arsenic from sulfuric acid. Cottrell's approach to the seperation resulted in a pure sulfuric acid mist. Cotrell then began to experiment with precipitation to condense the mist for the recovery of the sulfuric acid. He identified two major deficiencies in previous designs of precipitators: the power supply and the discharge electrode (used to generate corona). Utilizing the latest available power supply technology of the time (the synchronous mechanical rectifier and high voltage AC transformer) along with a pubescent (villous) discharge electrode. Cottrell filed his patent later that same year and received it in 1908.
The basic design developed by Cottrell has not changed that much over the years. Examining the patent picture below, gases enter the chamber (A) via an inlet (B) and encounter the high voltage electrode (C 7 c) where the particles become charged and are attracted to (A). The high voltage from the power supply (I,J,K,L,M,N,O) enters the chamber through an insulating bushing (H,h) that is pressurized from the backside (G).
How Does ESP Work?
In the simplest terms, a precipitator is a device that utilizes electrostatic forces for the collection of particulate. The particulate laden gases enter one area of the vessel and exit another area clean. Inside, high voltage electrodes impart a charge to the particles. Most modern precipitators utilize negative voltage electrodes though positive voltage electrodes do exist. These charged particles are then attracted to a collecting surface (grounded, neutral or oppositely charged). The particles build up on the collection surfaces over time and are then periodically removed, typically at set intervals.
What are the Different Types of ESP’s?
The vast majority of Industrial Electrostatic Precipitators are of the dry type, though wet precipitators are gaining popularity. Dry Electrostatic Precipitators are often referred to as Dry ESP's or DESP's while the Wet Electrostatic Precipitators are referred to as Wet ESP's or WESP's. Regarding particulate removal, the surfaces in a Dry ESP are rapped or vibrated, and the tubes in a Wet ESP are flushed , causing the particles to separate from the collection surface. In a Dry ESP the particles are usually evacuated from the hopper by rotary screws or drag chain conveyors . In a Wet ESP the hoppers are designed to gravity drain or pump the flush water for designated treatment or disposal.
What can be collected through Electrostatic Precipitation?
Precipitators can be used to collect many different kinds of particles with a wide range of physical properties. Some of the compounds that can be collected include:
On what processes are precipitators used?
Precipitators have been employed on many separate processes and pieces of process equipment such as:
In what industries are precipitators used?
Some industries that utilize precipitators include:
What factors influence the size of Electrostatic Precipitators?
There are many factors that can affect the correct sizing of the precipitator. Some characteristics such as Resistivity have a greater impact than others. Some factors include:
How is the size of a Precipitator determined?
The basic size of a precipitator can be determined through the Deutsch-Anderson Equation.
A = - ( Q / w ) * [ ln ( 1 - Eff ) ]
Where:
Drift velocity, or migration velocity, can be specifically defined as:
w = dp Eo Ep / ( 4 π µ )
Where:
Each type of particulate or process gas stream has a different migration or drift velocity associated with it. Once the process or particulate source is known a range of drift velocities can be selected. It is important to note that the drift velocities shown below are highly dependent upon not only the upstream process but the configuration and design of the precipitator as well. For example two identical processes each with their own precipitator made by a different manufacturer will often have different apparent drift velocities. This is because each manufacture has a different physical design in terms of gas flow, electrode design and power supplies.
How does moisture affect Dry Electrostatic Precipitators?
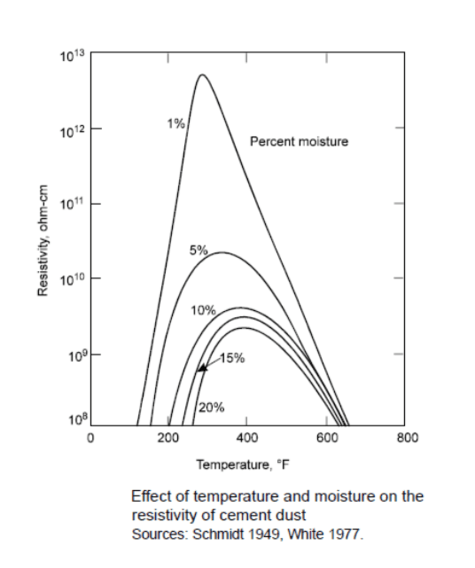
The gas stream moisture content affects the flow of electrons and the subsequent collection of particulates in that gas stream. The graph below shows the affects of moisture upon a gas stream containing cement dust. Normal dust resistivity ranges between 107 ohm-cm and 1010 ohm-cm. Precipitators whose gas streams exhibit high dust resistivity can improve their collection efficiency by adjusting temperature or introducing additional water through evaporation or steam addition or by adding other gas stream conditioning agents.
How does temperature affect Dry Electrostatic Precipitators?
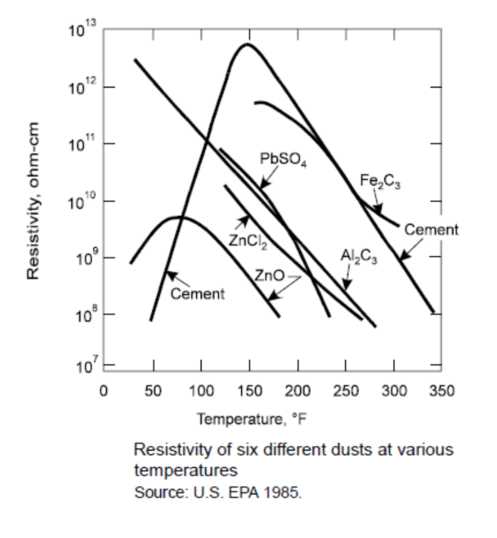
Temperature alone can affect the resistivity of the dust particles. The graph below shows how resistivity changes as temperature changes for a variety of dusts. Precipitators whose gas streams exhibit high resistivity can improve their collection efficiency by adjusting temperature or introducing additional water through evaporation or steam addition or by adding other gas stream conditioning agents.
How does velocity affect Dry Electrostatic Precipitators?
The gas stream velocity through the precipitator can affect performance in three fundamental ways.
How does particle concentration (grain loading, dust loading) affect Electrostatic Precipitators?
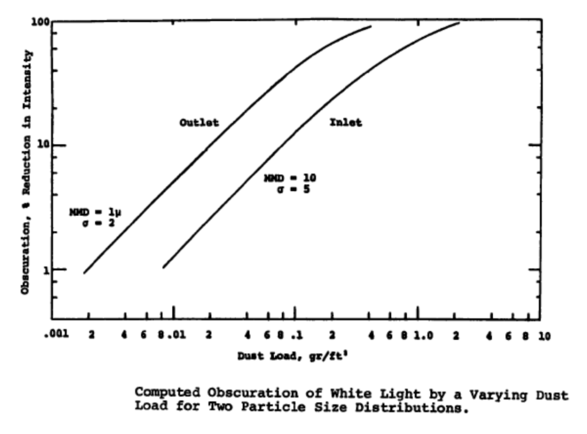
Large amounts of particulate can create excessive sparking inside the precipitator. Sparking is a normal phenomena where the current of the high voltage areas rushes to a grounded surface. Normal spark rates are less than 100 sparks per minute. Examining the equation for drift velocity presented above one can see that the charging voltage has a direct impact upon the calculation of w. The graph from "An Electrostatic Precipitator Performance Model (EPA-650/2-74-132) shows that the higher the grain loading the higher the reduction in charge intensity.
How does particle size affect Electrostatic Precipitators?
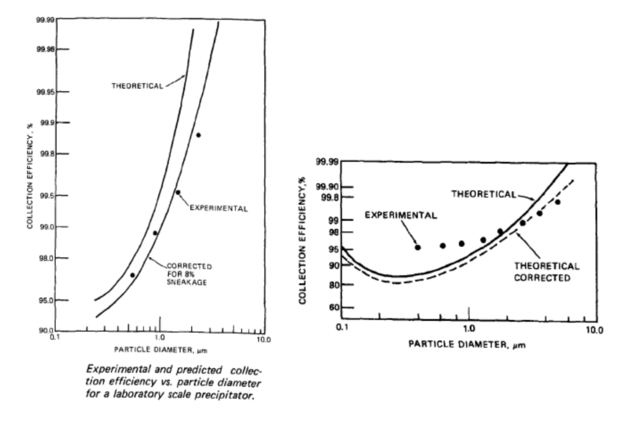
The larger the particle the more readily it can be collected in a precipitator. The graphs below provided in the EPA publication EPA-600/8-77-020b dated January 1978 shows the relationship between the particle diameter and collection efficiency as well as particle size and migration velocity.
How does voltage affect Electrostatic Precipitation?
The equation w=dpEoEp/(4µ) gives an indication how the collecting and discharge voltages affect drift velocity; the higher the collecting and discharge voltage the higher the value of migration (drift) velocity will be. Examining the Deutsch-Anderson Equation, also presented above, ( A= -[ Q / w ] x [ ln ( 1 - Eff ) ] reveals that as "w" (the denominator) increases in size the required collection plate area decreases. Simply put, for a give efficiency, as voltage increases the collection plate area required decreases. Therefore, for a given fixed amount of collection plate area, as voltage increases the efficiency increases.
The potential voltage that can be generated is based upon two primary limitations 1) the physical capabilities of the transformer and 2) the dielectric value of the gap between the high voltage electrode and collection electrode. All things remaining the same, the larger the gap the larger the dielectric value and the greater the potential voltage; larger gap = higher potential voltage.
Years ago, Japan had changed the particulate emission requirements for power plants with the result that many of their existing precipitators would have to be replaced or if room permitted added on to. Research and experimentation proved that the internal components could be removed and replaced with those with a larger gap between the high voltage electrodes and the collection plates while at the same time they installed transformers that could generate much higher voltages. The increasing of the gap resulted in less actual collection plate area because the external shell of the precipitators was a fixed sized. The result was an increase in efficiency with less collection plate area because of the increase migration velocity.
The Environmental Protection Agency (EPA) has recognized this feature, that voltage directly impacts collection efficiency, and has established criteria for the monitoring the power of consumed by precipitators as an indicator of performance.
How can the physical or mechanical design adversely affect the precipitator?
The physical design of the precipitator can impact collection efficiencies in three primary ways: Airflow, Voltage Potential, and Corona Generation.
What are the design considerations for inlet ducts and inlet nozzles?
Inlet ducts and nozzles should be designed with air flow dynamics and particle fallout or sticking in mind. The duct work leading to the precipitator has to have sufficient velocity to keep the particles from falling out of suspension and accumulating on the bottom of the duct. When enough particles collect on surfaces it acts as insulation that can allow the surface of the metal to cool and condense water that can cause corrosion of the duct. When the velocity is too high the particles can wear away the duct at bend locations. Bends or turns in the duct work can create unbalanced flow in that ductwork and upon entering the precipitator result in more flow in certain areas than others. Turning vanes should be used to reduce or eliminate non-uniform flow. The inlet nozzle itself should incorporate flow evening devices or screens to equalize non-uniform flow and spread the gas stream across the cross sectional area of the precipitator. The increase in cross sectional area of the inlet nozzle compared to the inlet duct work will reduce the velocity of the gases dramatically allowing the larger suspended particles to fall out therefore, the inlet nozzle must be designed in a way that facilitates the removal of these particles.
What are the design considerations for outlet nozzles, ducts and stacks?
Many of the same design considerations for inlet ducts and nozzles apply to the outlet ducts and nozzles but in reverse order. Flow evening devices in the outlet nozzle are often utilized to create uniformity of flow as the gases enter the outlet duct or stack and the outlet duct or stack is designed at velocities to eliminate corrosion or particle fallout. Regardless of whether the outlet nozzle is connected to a duct or stack if testing is to be performed then uniformity of flow is desired. Care should be taken, meaning turning vanes and flow uniformity devices should be utilized. In the case of stacks, velocity is vitally important because of rain and the fact that stacks are often not insulated. Two potential problems immediately come to mind if the velocity of the stack is insufficient. The first is that rain will be able to enter the stack and the velocity head of the flue gas will push that rain to the outer edges of the gas stream which would be the inside diameter of the stack. Most stacks on dry precipitators are constructed of carbon steel and the repetitive wetting of the stack will accelerate corrosion (rust). The second is that eddy currents can form along the side walls cooling the stack material that allows condensation to form with the same result.
Biofiltration
- Acetone
- Aliphatic Hydrocarbons
- Ammonia
- Anthranilates
- Aromatic Hydrocarbons
- Butadiene
- Carbon Disulfide
- Esters
- Ethanol
- Ethers
- Formaldehyde
- Heptane
- Hexane
- Hydrogen Sulfide
- Isopropanol
- Isopropyl acetate
- Ketones
- Methyl Ethel Ketone (MEK)
- Methanol
- n-Propanol
- N-propyl acetate
- Pesticides
- Phenol
- Pinenes
- Styrene
- Terpenes
- VM&P naphtha
- E is the enzyme being analyzed
- L is the concentration of the compound to be degraded
- EL is the developed complex (a complex is a group of two or more associated polypeptide chains)
- P is the product that regenerates the original enzyme
- Composting
- Door & Window Manufacturing
- Flavor & Fragrance Production
- Food Processing
- Frying Operations
- Medium Density Fiberboard (MDF)
- Paint Spray Booths
- Particleboard Manufacturing
- Pet Food Production
- Petro-Chemical Plants
- Pharmaceutical Production
- Photo and Film Production
- Printing
- Pulp & Paper Manufacturing
- Sewage Processing Plants
- Tanneries
- Textile Fabrication
- Wastewater Treatment Plants (WWTP)
- Solubility of Various Compounds in Water
- Compound mg/l @ 20°C
- Acetone Miscible
- Benzene 1,780
- Butadiene 735
- Ethanol Miscible
- Formaldehyde Miscible
- Heptane 3
- Hexane 9.5
- Isopropanol Miscible
- Methyl Ethyl Ketone (MEK) 27,500
- Phenol 8,300
- Styrene 300
What is Biofiltration?
Biofiltration is a process to purify air and water biologically with the aid of micro-organisms, specifically bacteria.
What is Industrial Biofiltration?
An Industrial Biofilter is a housing that contains and encourages the growth of vast numbers of bacteria through regulated temperature, humidity and pH for the destruction of volatile organic compounds (VOC's) and odor causing compounds (including NH3, CS2, H2S), in a way that can be quantified and measured, often for compliance purposes. Industrial biofilters utilize a group of aerobic organisms that are classified as chemotropic, meaning they derive the energy needed to live and degrade compounds from the reaction itself. As a point of fact organisms that derive their required energy from sunlight are classified as phototropic. Two sub-groups of the chemotrophs are the hetero-organotrophs and auto-lithotrophs. The sub group mainly utilized in biofilters are the hetero-organotrophs which have the ability to utilize the carbon in carbon compounds (i.e. methanol) as an energy source as well as the creation of cell components. As a point of fact auto-lithotrophs gain their energy through the degradation of non-organic compounds (NH3, H2S, S2O3, etc..).
What is the history of Industrial Biofiltration?
One of the earliest known uses of biofiltration in the Industrial Era was in World War I (1914 to 1918). Stagnant air was sucked out of tunnels and trenches, blown through earth where it would permeate and re-enter the tunnels and trenches. The air would be "cleaned" through the actions of bacteria naturally present in the soil. In 1923 the concept of treating off gases from sewage treatment plants was developed. In 1953 R.D. Pomeroy received a patent (#2,793,096) for "De-Odoring of Gas Streams by the use of Microbiological Growths" that arose out of a successful commercial application in California.
A high pressure blower (#12) is used to pull polluted gases (#11) through a pipe and inject it into a vertical header (#14) before it turns and becomes a horizontal header (#15) buried under a biologically active medium (#17) that is suspended above the header by a layer of permeable medium (#16) such as gravel or aggregate. The header is composed of perforated sections (#18) and non-perforated sections and couplings (#19). The basic design developed then is still used in many commercial applications today with the exception that the medium, or media, has changed. Since that patent, the major innovations in biofiltration have been in two areas: bacteria enhancement and media development.
How Does Industrial Biofilter Work?
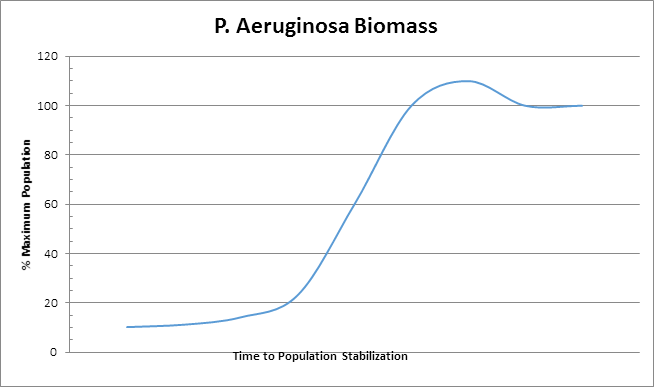
In the simplest terms, a biofilter is a device that utilizes natural biological oxidation for the destruction and / or removal of hydrocarbons (or CS2, H2S, NH3), that is to say biofiltration is the degradation of organic and inorganic substances by microorganisms. These microorganisms live in a biofilm coating that resides on the surface of a media composed of organic or inorganic (or a combination thereof) matter. The micro-organisms are stationary in regards to the system as a whole though they are mobile in their localized biofilm area. The process gases containing the contaminants to be treated flow through the media and as these gases flow by, molecules of contaminants pass very near to or directly contact the biofilm where they are absorbed into the biofilm. Noting that the biofilm is primarily composed of water one can see clearly that a compound's solubility in water will greatly impact ease of degradation because if the compound does not enter the biofilm then it cannot be decomposed by the micro-organisms in that biofilm. The biofilm also creates a fixed (more or less) inhabitable space that can only be utilized by a finite maximum number of organisms. The organisms will grow and expand until the available space (biofilm) is filled resulting in situation where no more effective growth can occur. This means that the effective amount of the summation of biomass (dead and alive) in the unit is relatively constant. An example of this is shown in the graph below.
What can be degraded in a Biofilter?
Biofilters can be used to degrade many different kinds of compounds within a wide range of industries. Some of the compounds that can be degraded include:
In general, more soluble compounds such as lower molecular weight alcohols, aldehydes and ketones are more easily treated in a biofilter than are aliphatic or aromatic hydrocarbons.
How are compounds degraded?
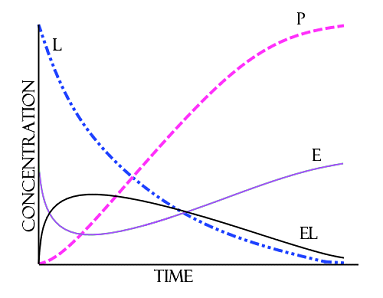
The bacteria produce enzymes that act upon compounds to break them down into the elementary constitutes of water and carbon dioxide. Each enzyme has the capability of altering a reaction and in fact several enzymes will often work upon the same compound at the same time. The presence of many different species of bacteria means there is wide variety of enzymes available at any single given space and time. These enzymes may remove a water molecule, break a C-H bond or C-C bond or add a water molecule. The fewer the variety of compounds supplied the greater the specialization of the population as a whole. For example if a biofilter is fed nothing but methanol then the reproducing populations will be geared toward the degradation of methanol, that is to say they will produce enzymes that are especially successful at degrading methanol as well as more of those enzymes. A basic understanding of the degradation process can be obtained by the examination of the Michaelis-Menten kinetics model. where:
On what processes are Biofilters used?
Biofilters have been employed on various processes and pieces of process equipment such as:
How is the size of a Biofilter determined?
Each type of compound or gas has a different potential of being utilized by the bacteria as food and as such a semi-empirical model is generated from test reaction and diffusion data gathered in lab scale, pilot scale, and full scale applications. Once the model is constructed a biofilter's media volume can be determined by entering the concentration of each known compound in the gas stream and not just the concentrations of the compounds to be degraded because bacteria will eat the most easily digested molecules first. As a general rule the more insoluble a compound is the less biodegradable that compound is, or to put it another way the less soluble a compound is more media, and thus bacteria, it will take to degrade that compound.
What factors can adversely affect Biofilters?
Virtually any force that affects the biofilm can affect the operation of the biofilter. Factors that can affect the biofilm include: Moisture, temperature, residence time, particulate load, nutrient availability, pH and poisons.
How does moisture affect the Biofilter?
The impact of moisture can be easily visualized, too little and the biofilm dries up and too much and overgrowth of organisms, desired and undesired, can occur. Each biofilter is different in terms of heat generation from the biological oxidation, heat capacity in terms of the mass and type of media, ambient conditions in terms of external heat loss or absorption, biofilter housing insulation coefficients, spacing of water irrigation nozzles and the irrigation nozzles themselves. In order to account for all of these variables industrial biofilters are irrigated with an over bed spray system (OBS) that is controlled by a microprocessor, usually a programmable logic controller (PLC), that allows the user to control water application by zone, by time of day and day of week. Some processes only operate eight hours a day, five days a week, so applying water on a 24/7 schedule would result in uncontrollable biological that would blind off the media resulting in excessive pressure drop. Increased pressure drop usually means either decreased flow or channeling (unbalanced flow through the media) resulting in operational issues with the plant.
How does temperature affect Biofiltration?
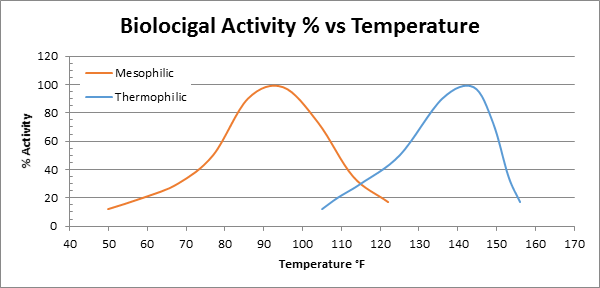
Temperature has a direct impact biological activity of the bacteria, in other words how fast they can digest any given molecule, how fast they move and how fast they reproduce. Temperatures above 104°F start to encourage the growth of thermophilic microorganisms that do not have the ability to degrade or are less efficient at degrading the compounds. In recent years much money and time has been spent in developing and quantifying organisms that can efficiently degrade the compounds. The below graph is a typical example of the biological activity of mesophilic bacteria. It is important to note that increased biological activity does not necessarily mean increased appetite in terms of the rate of degradation or molecules per hour degraded by a particular micro-organism.
In reality temperature effects in a biofilter are very difficult to predict because in addition to affecting biological activity, temperature can also affect the physicochemical properties such as solubility , diffusivity and Henry's law coefficient of the compounds in the gas stream. The chart below shows a biofilter's biological activity of bacteria versus temperature.
How does residence time affect Biofiltration?
Like many other air pollution control technologies the longer any particular pollutant molecule (particulate matter, nitrous oxide, carbon monoxide, etc..) is within the treatment zone of the equipment the more time that equipment has to act upon that molecule. In a biofilter a longer residence time means an increased chance of any particular gaseous molecule will contact a biofilm, be absorbed into the water of that biofilm and subsequently captured and bio-degraded by an organism. Once captured the complexity of that particular compound will dictate the digestion time required to break it down into its simplest elemental constitutes (carbon dioxide, water, etc...).
How does particulate loading affect Biofiltration?
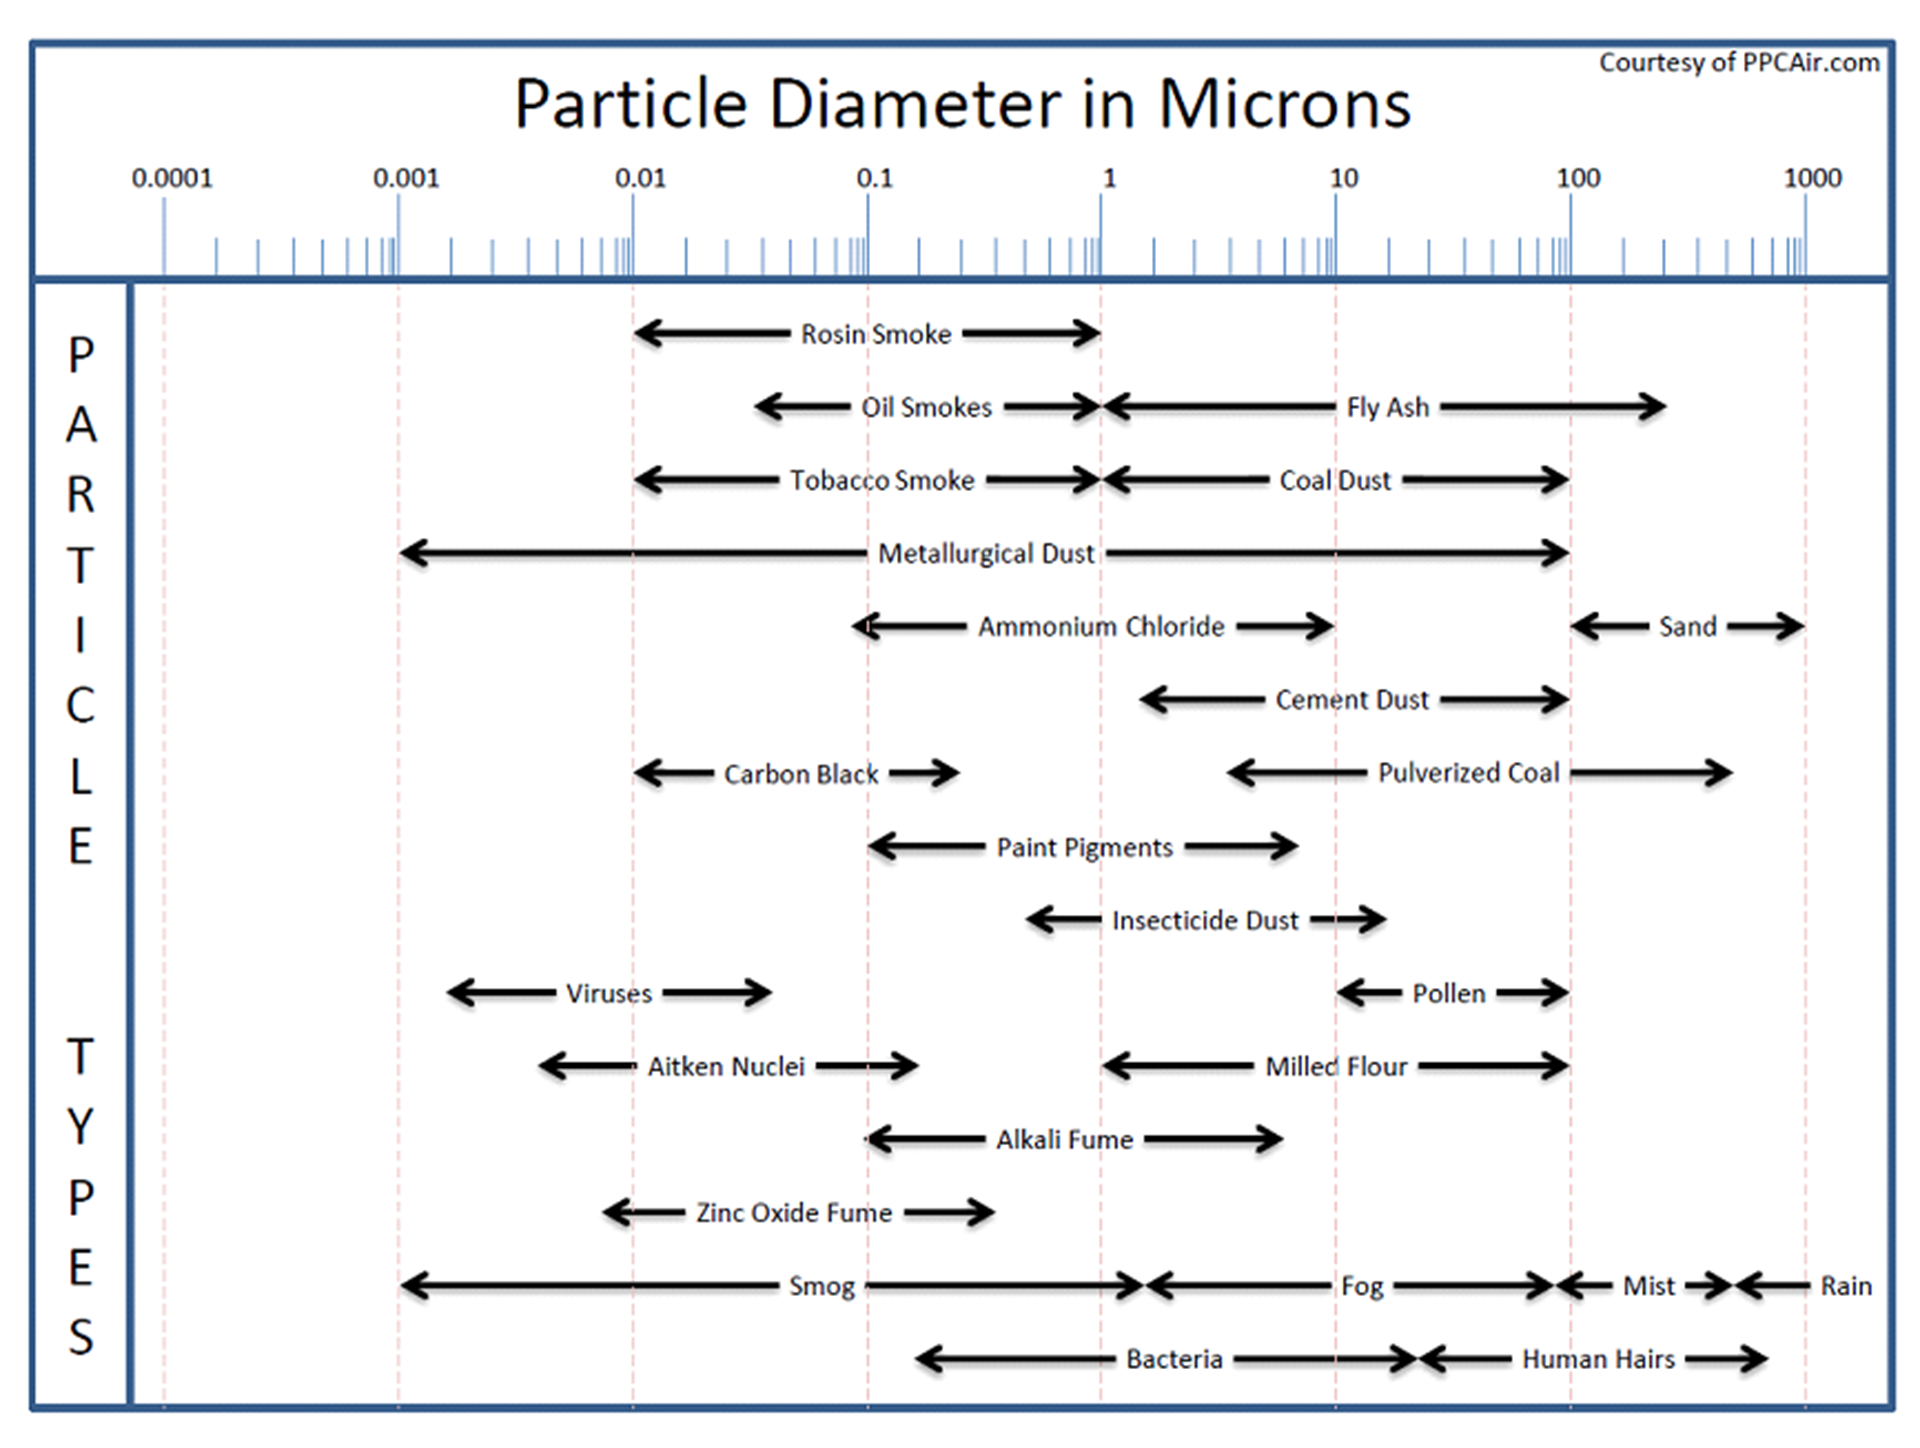
Particulate matter comes in many different sizes and as such some can affect the biofilter while others do not. The two simplified vast extremes are the very small and the very large. Very small particles such as smoke, viruses and smog can pass through the biofilter without ever actually contacting a single water particle, media particle or biofilm. These particles are so small they follow the path of the flue gas and thus avoid any collisions. The very large particles such as sand, ash, sawdust and pollen can collect on the surface or fallout in the media. Over time these large particles can fill the void spaces that the air uses to travel through the media thus creating excessive pressure drop. A secondary affect can be that these large particles provide food for other organisms present in the media such as slimes and fungi with the result being the same; these organisms fill the voids resulting in excessive pressure drop. The gray area, those particles that are definitively not large and definitively not small, lies in the 1 to 10 micron range and their affect on the system can vary with each individual biofilter.
How does compound concentration affect Biofiltration?
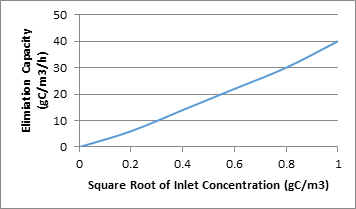
If, gas streams with high concentrations of a particular compound, the primary compound and low concentrations of a secondary compound then the resultant population of bacteria is geared toward the degradation of the primary compound and not the secondary compound, unless of course the secondary compound is part of the degradation path of the first compound. The graph below shows an example of how the inlet concentration has an effect on the elimination capacity of a biofilter.
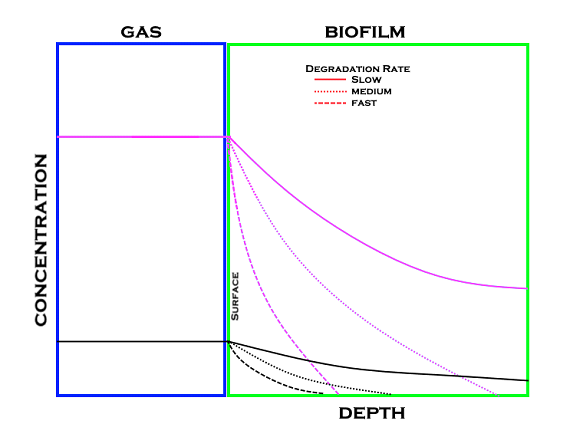
Coupling gas concentrations with degradation rates the below diagram can be used to visualize the relationship between the two. The easier a compound is to degrade the faster it is degraded and thus does not have a chance to move deeper into the biofilm.
How does solubility affect Biofiltration?
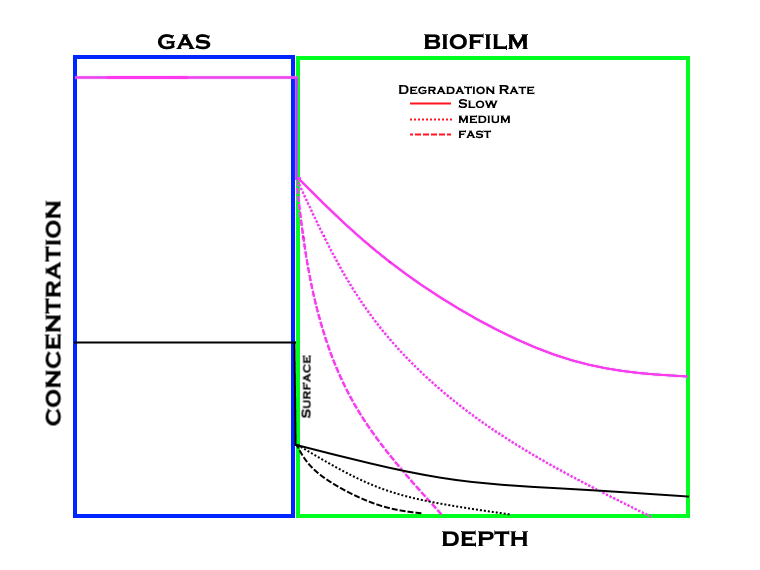
One of the keys to successful biological oxidation is the degradation of the compounds. In order for this degradation to take place the compound must be where the bacteria and its enzymes can affect it, which is in the biofilm that is composed mainly of water. If a compound is not very water soluble then the molecules of the compound want to stay in the vapor phase and not dissolve in the water that makes up the biofilm. Coupling solubility, gas concentrations with degradation rates the diagram below can be used to visualize the relationship between the three. Note that from the previous graph the gas concentration is considerably higher than that in the biofilm.
How does increased pressure drop across the media affect plant operations?
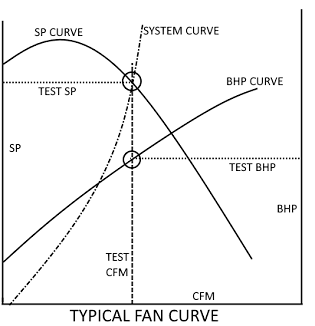
To understand how increased pressure drop in the system affects plant operations one must have a basic understanding of how to read a fan curve. In reference to the figure below CFM is the amount of airflow which is usually given in actual cubic feet per minute and SP is static pressure which is usually given in inches of water column. Point of fact there is 27.7 inches of water in 1 PSI. For a given system (fan, biofilter, bioscrubber, duct, etc..) there is a SYSTEM CURVE. This system curve is a plot of airflow (CFM) vs pressure drop (SP). Each fan will have static pressure curve (SP CURVE) developed by the manufacturer of the fan. Dropping a line straight down from the intersection of the SYSTEM CURVE and the SP Curve to the x-axis will yield the amount of airflow that the fan will move. The intersection of the drop line and the BHP CURVE will yield the brake horsepower (BHP) required by the motor to generate the air flow (shown on the second y-axis). Drawing a line left from the intersection of the SYSTEM CURVE and the SP CURVE will yield the static pressure at that intersection point.
It is of vital necessity the process engineer or system designer take into account each potential pressure drop source (media, packing, transitions, support grids, direction changes, entrances and exits). Failure to accurately take these pressure drops into account can result in a system that has a desired operating point outside (above or to the right) of the SP Curve or in a situation where there is not enough horsepower available. Of these two the lack of horsepower is the easiest and most economical to fix though it may require pulling new cable and conduit but when you are also considering replacing 300hp motors and variable frequency drives (VFD's) the bill can add up to hundreds of thousands of dollars very quickly.
How can the physical or mechanical design adversely affect the biofilter?
Mechanical design in a biofilter has ramifications from the inlet nozzle all the way through to the outlet nozzle. Improper inlet design can result in air flow imbalances across the width of the biofilter that can never be corrected short of full reconstruction of the inlet. Improper packing design can result in decreased efficiency removal in the bio-scrubber section as well as increased pressure drop. Improper demister design can allow water carryover onto the media surface that encourage the growth of unwanted micro-organisms. Improper selection of the media itself can result in high pressure drops and encourage the growth unwanted micro-organisms as well such as fungus. Improper outlet design can result in excessive pressure drop (ie in the 3" to 5" range).
How does the Process and Instrumentation Diagram for an Biofilter look?
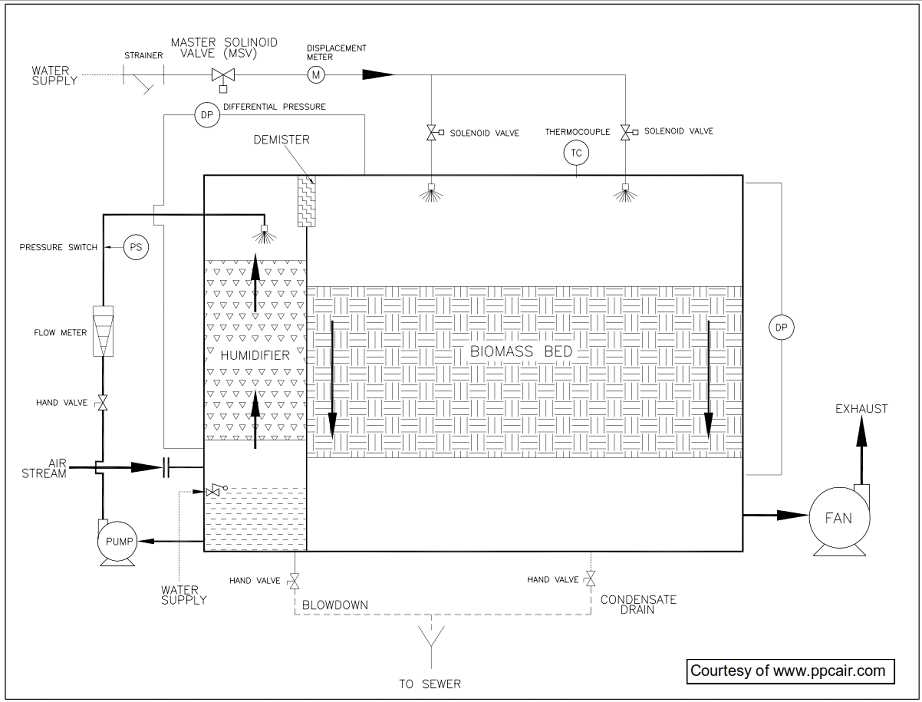
Various instrumentation, such as temperature, pressure, pH and humidity, are required on biofilter to monitor and predict the performance of the bacteria. A sample Process and Instrumentation Diagram (PID) is shown